Autonomous Application Performance Monitoring

Autonomous AI APM for Modern Engineering Stacks.
Trace Spans, Slow Queries, Memory Leaks & SLOs 24/7.

Deploy RhinoAgents to continuously analyze distributed traces, isolate microservice latency bottlenecks, detect memory leaks, track SRE error budget burn rates, and execute automated self-healing runbooks in real time.

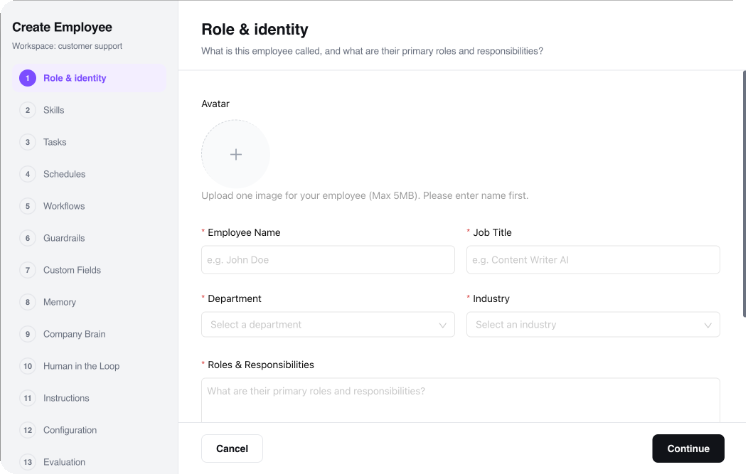
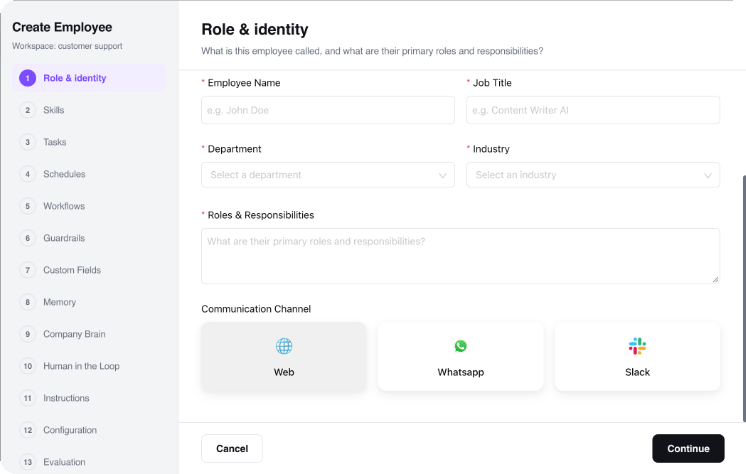
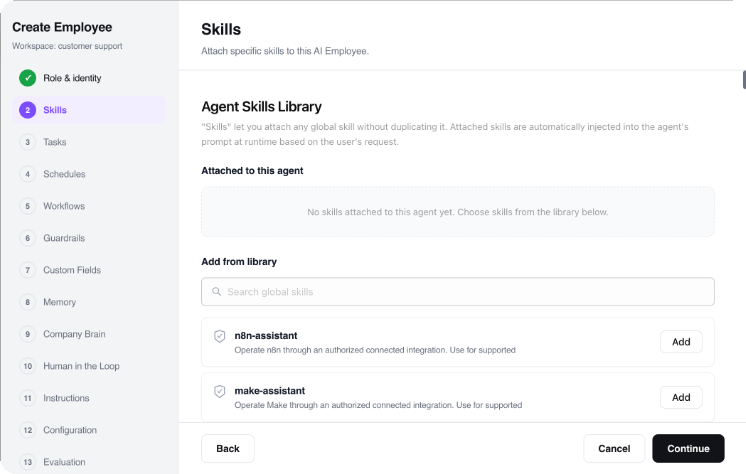
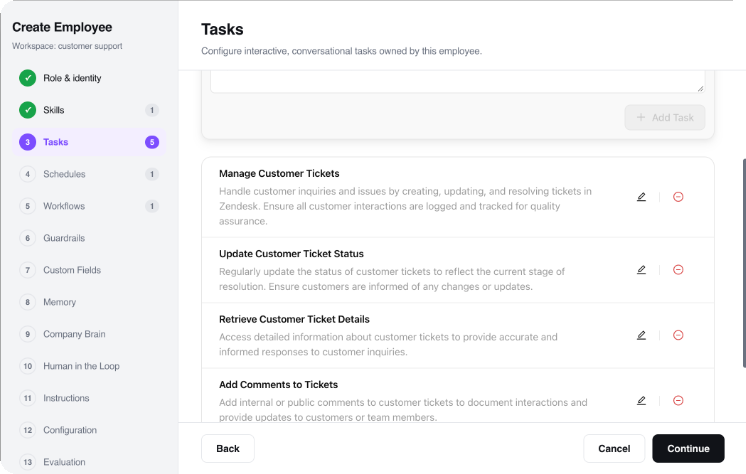
Describe your APM & SLO rules — RhinoAgents configures the monitoring agent
OpenTelemetry Native Tracing Automated N+1 Query Isolation Real-Time Error Budget Burn Rates SOC 2 & GDPR Certified
80%
Reduction in Application Incident MTTR (Mean Time to Resolution)
< 3 min
Time to Pinpoint Slow SQL Query or Microservice Span
100%
Tail-Based Trace Sampling for Critical P99 Errors
99.99%
SLO & Error Budget Protection Compliance
Next-Gen SRE Observability

What is AI Application Performance Monitoring?

AI Application Performance Monitoring (APM) is the practice of utilizing autonomous AI agents to continuously observe distributed application traces, code runtime execution, memory allocations, and database queries. Rather than requiring developers to manually explore trace graphs during an outage, the agent automatically isolates latency bottlenecks and diagnoses performance regressions.

By correlating Git deployment commits, Kubernetes pod metrics, and SQL query execution plans, RhinoAgents translates raw OpenTelemetry spans into actionable natural-language SRE root cause briefs and automated remediation runbooks.

// Core APM Telemetry Pillars
Distributed Tracing Analysis
End-to-end trace waterfall inspection across microservices and async queues.
Database & Slow Query Telemetry
Automated detection of unindexed SQL, table locks, and N+1 query loops.
SLO & Error Budget Tracking
Multi-window burn rate calculation based on Google SRE standards.
APM Intelligence Lifecycle

How the AI APM Agent Operates

Follow application telemetry from OpenTelemetry distributed span capture through trace bottleneck analysis, slow SQL isolation, error budget tracking, and automated runbook self-healing.

01
Ingestion

Distributed Span & Trace Ingestion

Ingests OpenTelemetry (OTel) distributed traces across microservices, HTTP handlers, gRPC calls, and Kafka message brokers.

Supported Frameworks:
  • Node.js, Python, Go, Java, .NET, Rust runtimes
  • Kubernetes, AWS ECS, Google Cloud Run, Lambda
  • PostgreSQL, MySQL, MongoDB, Redis, Kafka
02
Sampling

Intelligent Tail-Based Sampling

Retains 100% of P99 slow traces and 5xx error spans while intelligently sampling mundane requests to reduce cloud storage costs by 70%.

Sampling Filters:
  • 100% retention on P99 latency spikes > 1.5s
  • 100% retention on HTTP 500/502/504 errors
  • Adaptive sampling on standard HTTP 200 paths
03
SQL Intel

Slow SQL & N+1 Query Detection

Inspects database spans to uncover unindexed table scans, connection pool starvation, and runaway N+1 query loops.

Database Checks:
  • Sequential scan on large unindexed tables
  • N+1 ORM query loop identification
  • Connection pool saturation & lock graph depth
04
SLO Watch

SLO & Error Budget Burn Rate Tracking

Continuously calculates 1-hour and 6-hour error budget burn rates, alerting before your 99.9% uptime SLA is breached.

Google SRE Formula:
Burn Rate = (Errors / Total Requests) / (1 - Target SLO)
• Multi-window alerting (14.4x burn rate = 1 hr warning)
• Automated deployment freeze on critical burn
05
Memory Intel

Memory Leak & GC Pause Isolation

Tracks heap allocation slopes and garbage collection pause durations, predicting OutOfMemory (OOM) crashes days in advance.

Runtime Telemetry:
  • 📈 Heap Allocation Slope: Unreleased object growth
  • ⏱️ GC Pause Spike: JVM Stop-the-world latency
  • 🧵 Thread Saturation: Blocked async worker pool
06
Runbook

Automated Runbook & Self-Healing

Executes pre-approved remediation: restarting leaking pods, scaling HPA targets, rolling back faulty canaries, and dispatching SRE alerts.

Automated Output:
  • Kubernetes pod graceful restart & auto-scaling
  • Canary release rollback on P99 latency regression
  • Slack SRE incident brief with span waterfall link
// Continuous Autonomous APM & Error Budget Protection Architecture
1. OTel Span Ingest 2. Tail Sampling 3. Slow SQL & Trace Triage 4. Error Budget Burn Watch 5. Runbook Self-Healing
Interactive Utility

Live Application Performance & SLO Simulator

Simulate how RhinoAgents evaluates production microservice latency, isolates slow queries, tracks error budgets, and executes self-healing runbooks.

1. Configure Application Stack

Live APM Reliability Index TIER 1 (OPTIMAL PERFORMANCE)
Application Health Score
85
out of 100 maximum APM performance points
Trace & Query Health
45 / 50
SLO Budget Protection
40 / 50
AI APM Diagnosis:
Exceptional application telemetry. OpenTelemetry spans active with automated slow SQL isolation and error budget burn rate tracking. Zero memory leaks detected.
Autonomous Trigger Action:
Stream trace spans → Index unindexed SQL queries → Auto-scale Kubernetes deployment if P99 latency > 400ms.
Architectural Comparison

Passive APM Dashboards vs RhinoAgents AI APM Agent

Why static charts and passive APM dashboards fail to stop cascading microservice outages, and how autonomous AI agents isolate root causes in seconds.

Capability / Dimension Traditional APM Dashboards RhinoAgents Autonomous AI APM Agent
Trace Analysis & RCA Passive flame graphs requiring manual developer clicking and span inspection. Autonomous trace traversal isolating slow SQL and bottleneck microservices in < 3 mins.
SLO & Error Budget Tracking Static uptime percentages calculated retroactively at the end of the month. Real-time multi-window burn rate tracking following Google SRE principles.
Database Query Telemetry Logs slow queries exceeding hardcoded thresholds without ORM context. Identifies unindexed queries, table deadlocks, and N+1 loop patterns automatically.
Memory Leak Prediction Only alerts after an OutOfMemoryError (OOM) crashes the container. Analyzes heap allocation trends and GC pause curves to predict OOM crashes days ahead.
Incident Remediation Zero action capabilities; strictly a read-only monitoring dashboard. Automated runbook triggers: restarts pods, scales resources, and rolls back canary releases.
Agent Library

8 Prebuilt AI Agents for APM & SRE

Each agent handles a critical application performance touchpoint. Connect your OpenTelemetry collectors, Kubernetes clusters, and alerting tools — and deploy in minutes.

Distributed Trace Waterfall Agent
Traverses multi-hop microservice spans to pinpoint the exact downstream RPC call or queue causing P99 latency spikes.
Span WaterfallP99 LatencyRPC Triage
Slow SQL & N+1 Query Agent
Detects unindexed database table scans, sequential query loops, and connection pool exhaustion before outages strike.
Slow SQLN+1 QueriesPool Health
SLO Error Budget Burn Rate Agent
Calculates real-time 1h, 6h, and 24h burn rates, triggering SRE alerts and freezing CI/CD deploys before SLA violations.
Error BudgetsSRE Burn RateSLA Protection
Memory Leak & GC Optimizer Agent
Monitors heap memory growth slopes and JVM garbage collection pause times to prevent OutOfMemory (OOM) container crashes.
Heap TrendsGC PausesOOM Defense
Canary Deployment Performance Agent
Compares latency and error rates of canary pods against production baselines, executing instant rollbacks upon regression.
Canary DiffsAuto RollbackCI/CD Guard
Tail-Based Trace Sampling Agent
Guarantees 100% capture of error spans and high-latency requests while dynamically sampling normal traffic to cut costs.
Tail SamplingCost ControlFull Error Capture
Kubernetes Auto-Healing Agent
Automatically adjusts horizontal pod autoscaling (HPA) and restarts frozen pods in CrashLoopBackOff state.
K8s HealingHPA Auto-ScalePod Restarts
Automated SRE Post-Mortem Agent
Generates complete markdown post-mortems with incident timelines, root cause evidence, and remediation verification.
Auto Post-MortemTimeline DiffRCA Markdown
Operational Gaps vs AI

Common Bottlenecks.
AI-Powered Execution.

SRE teams lose weeks every year digging through flame graphs and war rooms — all preventable with autonomous AI APM agents.

Traditional APM Bottlenecks
Manual trace waterfall inspection during Sev-1 outages
Engineers spend 45+ minutes clicking through hundreds of distributed spans to locate which microservice introduced downstream latency.
Exhausting monthly SLO error budgets without early warning
A subtle increase in 5xx error rates burns 80% of your monthly SLA budget before engineers realize an incident is in progress.
Unindexed N+1 database queries slipping into production
Developers deploy code containing N+1 query loops that pass unit tests but cause severe database connection pool starvation under load.
Skyrocketing APM SaaS billing from uncompressed trace ingestion
Standard APM tools charge exorbitant rates to ingest billions of routine 200 OK traces with zero intelligent tail-based filtering.
RhinoAgents Autonomous Solution
Instant microservice bottleneck isolation in under 3 minutes
The AI agent autonomously traverses distributed trace trees, outputting the exact slow span, root cause, and suggested remediation code.
Predictive multi-window SRE error budget burn rate alerts
Calculates 14.4x and 6x burn rates in real time, alerting on-call engineers hours before SLA threshold breaches occur.
Automated detection & indexing of slow SQL queries
Continuously monitors database spans to identify missing indexes and ORM loops, delivering copy-paste SQL migration fixes.
Intelligent tail-based sampling cutting APM costs by 70%
Captures 100% of P99 and error spans while efficiently sampling routine traffic, saving tens of thousands in telemetry bills.
Why RhinoAgents?

Enterprise APM & Telemetry Architecture

Built for large-scale microservice architectures requiring OpenTelemetry standards, sub-second trace indexing, and automated SRE runbooks.

Production Runbook Guardrails

Safe, bounded auto-remediation. Set strict policy limits on automated healing actions—requiring manual confirmation for destructive operations while auto-executing safe pod restarts.

Bounded Actions Policy Guardrails

Service Topology & Span Memory

The agent maintains long-term memory of your microservice dependency graph, typical P99 latency baselines, and historical slow query patterns across all releases.

Topology Graph Baseline Memory

Modular APM Skills

Equip agents with specific operational Skills from our library. Dynamic skills like "OTel Trace Analyzer", "Postgres Slow Query Explainer", or "Kubernetes Pod Scaler" execute in sub-seconds.

OTel Native Zero Prompt Bloat

Model Context Protocol (MCP)

Connect your APM agent natively to internal Kubernetes clusters, Prometheus endpoints, or database replicas via secure MCP servers with zero custom glue code.

Native MCP Support Direct K8s Query

Human-in-the-Loop (HITL)

Set approval gates for high-stakes remediation—such as database failovers, production rollbacks, or traffic shedding during high-traffic events.

1-Click Slack Review SRE Approval Gates

Immutable Audit Logging

Full telemetry audit trails of every trace span, error budget alert, auto-scaling action, and remediation command executed with 100% SOC 2 Type II and GDPR compliance.

Audit Diffs SOC 2 Certified
Application Performance Protection

6 Critical Leaks in Application Performance — Fixed by AI

Every second of microservice latency degradation burns error budgets and frustrates users.

Leak 1
Hidden Microservice Latency in Multi-Hop Traces
An API call traverses 14 different microservices, making it impossible to manually tell which async dependency is causing a 2.5s response delay.
AI Fixes This
Autonomously analyzes distributed trace waterfall spans
Calculates critical path latency contributions in milliseconds
Identifies blocked thread pools and slow gRPC calls
Leak 2
Unindexed N+1 SQL Queries Freezing DB Pools
A newly deployed ORM query executes 500 individual SQL calls inside a loop, exhausting PostgreSQL connection pools during peak traffic.
AI Fixes This
Detects repeated query patterns and missing index scans
Outputs exact SQL execution plan diffs and recommendations
Prevents database pool starvation and table locks
Leak 3
Silent SLO Error Budget Exhaustion
An intermittent 502 error burns through 90% of your quarterly SLA error budget before engineers realize a customer impact event occurred.
AI Fixes This
Monitors multi-window burn rates (1h, 6h, 24h) in real time
Triggers proactive PagerDuty alerts on rapid burn spikes
Enforces automatic deployment freezes to protect uptime
Leak 4
Creeping Memory Leaks Causing OOM Crashes
Unreleased object references cause container heap memory to grow steadily over 5 days, culminating in sudden midnight OOMKilled crashes.
AI Fixes This
Models long-term heap allocation slopes and GC pause times
Predicts container OOM crashes days in advance
Triggers graceful rolling pod restarts before outages occur
Leak 5
Silent Performance Regressions in Deployments
A code change doubles CPU usage and adds 200ms of latency, passing integration tests and reaching production undetected.
AI Fixes This
Compares canary release spans directly against baseline traces
Detects P99 latency regressions in pre-production staging
Automatically halts CI/CD promotion to protect users
Leak 6
Runaway APM Telemetry SaaS Bills
Traditional APM SaaS tools charge per gigabyte for routine 200 OK spans, leading to surprise $80,000 monthly telemetry invoices.
AI Fixes This
Applies intelligent tail-based sampling at the collector edge
Retains 100% of P99 and error spans while sampling routine traffic
Reduces APM telemetry storage costs by 70%
ROI Model

Calculate Your APM & SRE ROI

Estimate the cloud telemetry savings and engineering hours recovered by eliminating manual trace debugging and alert storms.

Monthly Production API Transactions 100,000,000 txns
Monthly APM & Telemetry SaaS Spend $18,000 / mo
SRE & Backend Engineering Team Size 10 Engineers
$240,000
Estimated Annual Telemetry & SRE Engineering Savings
400 hrs
Monthly SRE Debugging Hours Saved
80%
Application MTTR Reduction
Enterprise Standards

Enterprise Architecture, Compliance & Security

RhinoAgents is built for mission-critical enterprise telemetry — delivering full OpenTelemetry compliance, SOC 2 Type II certification, and 99.99% uptime.

OpenTelemetry Native
Complies with OTel semantic conventions. Zero vendor lock-in; export trace spans to any backend.
OTel Semantic
SOC 2 & GDPR
Bank-grade AES-256 encryption at rest and TLS 1.3 in transit. Zero model training on your telemetry data.
SOC 2 Type II
Granular RBAC
Role-based controls for SRE Engineers, DevOps Leads, Developers, and Compliance Officers.
Okta SSO
99.99% Uptime SLA
High-availability multi-region cloud infrastructure guarantees continuous span ingestion at scale.
Auto-Scaling
Tool Ecosystem

Integrates With Your APM & Kubernetes Stack

RhinoAgents connects natively with major distributed tracing collectors, databases, Kubernetes clusters, and alerting platforms.

OpenTelemetry (OTel)
Native Trace & Span Ingest
Kubernetes (K8s)
Pod Telemetry & Self-Healing
Postgres / MySQL / Redis
Slow SQL Query Analytics
PagerDuty & Slack
Instant SRE Incident Dispatch
Full Infrastructure Suite

Connect AI APM to the Entire Enterprise Ecosystem

Combine application performance monitoring with anomaly detection, AI LLM observability, SAP automation, lead scoring, and customer service agents.

AI Anomaly Detection Agent AI LLM Observability Agent AI SAP Process Agent AI Lead Scoring Agent AI SEO & GEO Agent 55+ Website AI Chatbots 102+ Voice AI Call Agents All 81 AI Agent Pages
FAQ

Frequently Asked Questions About AI APM Monitoring

Everything you need to know about distributed tracing, slow SQL query detection, and SLO error budget protection.

An AI APM Agent is an autonomous software worker that continuously ingests distributed traces, code execution metrics, database queries, and server logs. It actively correlates slow service spans, predicts memory leaks, tracks SLO error budget burn rates, and triggers automated remediation.

"RhinoAgents caught an unindexed SQL query in our canary deployment that would have crashed our checkout microservice on Cyber Monday. It saved us an estimated $420,000 in prevented downtime."

Marcus Vance — VP of Engineering, Global E-Commerce Platform

Ready to Master Application Performance & SRE Observability?

Deploy your custom AI APM Agent in under an hour, connect your OpenTelemetry pipeline, and protect your error budgets.

Schedule APM Demo Start 14-Day Free Trial
No credit card required OpenTelemetry Native Standard SOC 2 Type II Certified