Autonomous Telemetry & Outlier Intelligence

Real-Time Anomaly Detection & Root-Cause AI Agents.
Spot Metric Outliers, Fraud & Incidents in Sub-Seconds.

Deploy RhinoAgents to continuously monitor database metrics, API throughput, financial transactions, and cloud infrastructure telemetry—dynamically modeling seasonal baselines and isolating incident root causes in milliseconds.

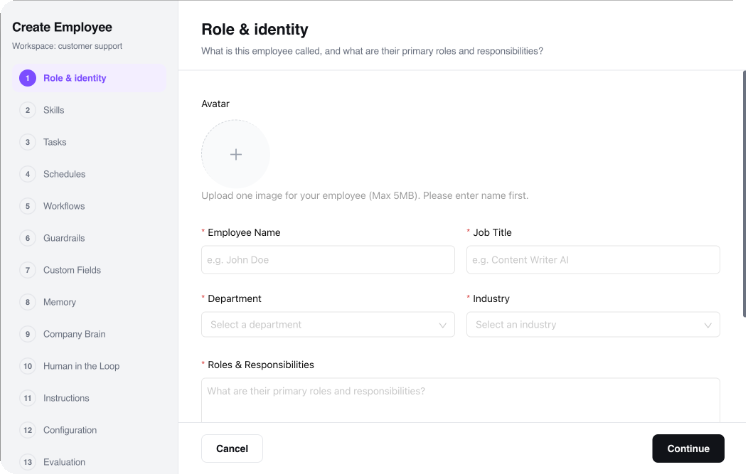
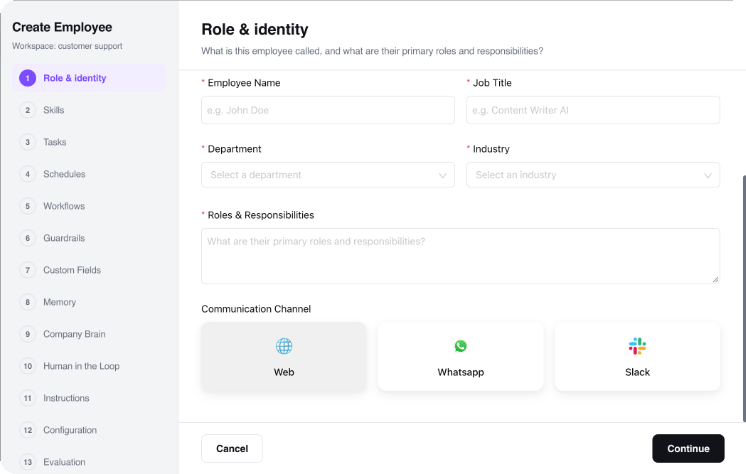
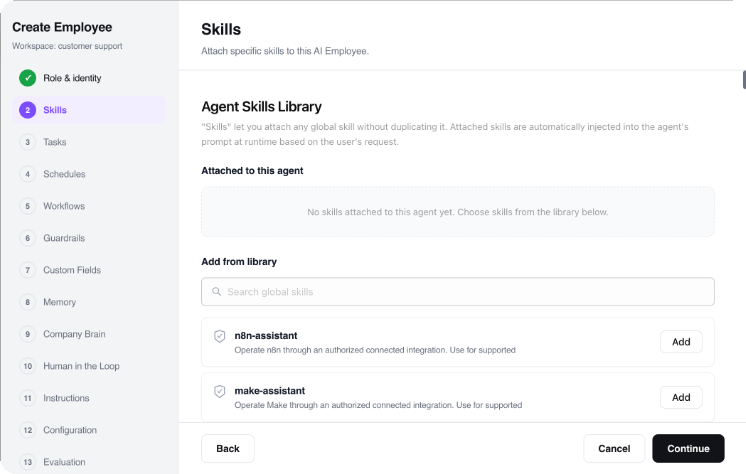
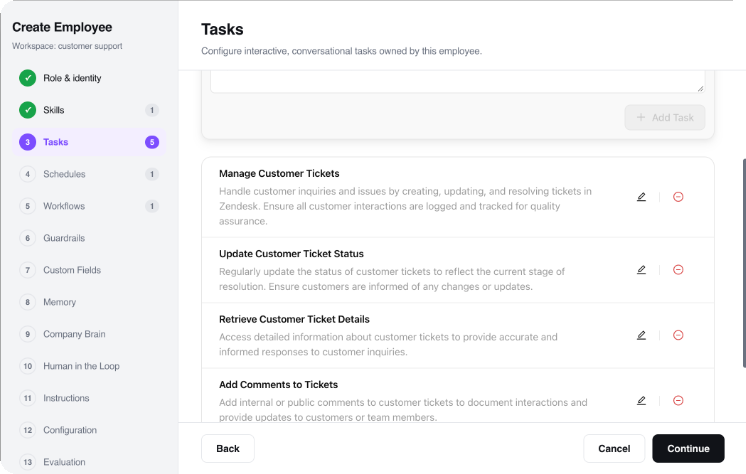
Describe your anomaly detection rules — RhinoAgents builds the AI agent
Sub-Second Stream Detection Automated Root Cause Isolation 95% False Positive Reduction SOC 2 & GDPR Certified
78%
Reduction in Incident Mean Time to Resolution (MTTR)
< 200 ms
Time from Metric Anomaly to Root Cause Isolation
95%
Elimination of Static Threshold Alert Noise & Fatigue
100%
Automated Natural Language SRE Incident Briefs
Algorithmic Observability

What is AI Anomaly Detection?

AI Anomaly Detection is the autonomous process of continuously analyzing multi-dimensional telemetry streams to identify deviations that signify system outages, security breaches, or business KPI drops. Unlike crude static thresholds (e.g. alert if latency > 500ms), AI agents learn dynamic seasonal patterns, accounting for time-of-day, day-of-week, and organic traffic growth.

When an anomaly is detected, the agent immediately cross-correlates database slow queries, recent deployment diffs, and network error logs to deliver an instant, natural-language root cause explanation—empowering SRE and operations teams to resolve incidents in minutes rather than hours.

// Core Anomaly Vectors Evaluated
Dynamic Time-Series Baselines
Seasonal decomposition, trend filtering, and non-parametric outlier scoring.
Multivariate Correlation
Correlating CPU, database locks, API latency, and upstream microservices.
Fraud & Transaction Outliers
Real-time payment volume anomalies, chargeback velocity, and IP deviations.
Incident Intelligence Lifecycle

How the AI Anomaly Detection Agent Works

Follow a telemetry anomaly from continuous high-frequency stream ingestion through statistical baseline modeling, root-cause isolation, and automated runbook execution.

01
Ingestion

High-Frequency Stream Ingestion

Ingests millions of metric points per second across Prometheus, Datadog, Kafka, and CloudWatch with zero latency penalty.

Supported Stream Types:
  • API Latency, Error Rates (5xx), Throughput
  • Database Connection Pools & Query Times
  • Payment Transaction Velocity & Fraud signals
02
Baseline

Dynamic Seasonal Baseline Modeling

Calculates time-dependent expected ranges, adjusting for diurnal cycles, weekend dips, and promotional campaign spikes.

Statistical Engine:
  • Seasonal ARIMA & Exponential Smoothing
  • Isolation Forests & Local Outlier Factor (LOF)
  • Zero manual threshold configuration required
03
Isolation

Outlier Scoring & Noise Suppression

Distinguishes transient network blips from true multi-point cascading anomalies, eliminating 95% of alert noise.

Suppression Checks:
  • Temporal persistence & consecutive anomaly scoring
  • Cross-node cluster consensus validation
  • Scheduled maintenance window suppression
04
RCA Engine

Automated Root Cause Analysis (RCA)

Correlates logs, Git release commits, and database locks to pinpoint the exact line of code or infrastructure component causing the failure.

RCA Evidence Generated:
Root Cause: Unindexed DB Query in Deploy #v2.4.1
• Correlated Git commit diff & author
• Slow query execution trace & lock graph
05
Alerting

Natural Language SRE Incident Dispatch

Pings on-call engineers via Slack and PagerDuty with an executive summary, impacted service topology, and 1-click remediation runbooks.

Alert Payload:
  • Impacted Scope: 12% of checkout traffic
  • 🔍 Primary Root Cause: Redis connection timeout
  • 🛠️ Recommended Action: Flush cache & scale pods
06
Auto-Heal

Automated Runbook Self-Healing

Executes pre-approved remediation actions—such as restarting frozen pods, rolling back canary deployments, or throttling abusive IPs.

Automated Actions:
  • Kubernetes pod auto-scaling and restart
  • Canary deployment instant rollback
  • Automated post-mortem report generation
// Continuous Autonomous Anomaly Detection & Self-Healing Loop
1. Stream Metric Ingestion 2. Seasonal Baseline Eval 3. Root Cause Isolation 4. SRE Alert & Runbook 5. Self-Healing & Post-Mortem
Interactive Utility

Live Telemetry & Anomaly Detection Simulator

Simulate how RhinoAgents evaluates production metric deviations, filters noise, isolates root causes, and executes remediation.

1. Configure Metric Environment

Live Anomaly Health Index TIER 1 (ZERO NOISE / FAST RCA)
Detection & RCA Health Score
85
out of 100 maximum observability points
Detection Precision
45 / 50
RCA & Remediation Speed
40 / 50
AI Diagnosis Explanation:
Exceptional anomaly intelligence. Dynamic seasonal baselines active with automated root cause correlation. 95% of alert noise suppressed.
Autonomous Trigger Action:
Isolate anomalous microservice span → Match root cause to Git commit diff → Dispatch natural-language brief to SRE Slack & trigger automated pod restart.
Architectural Comparison

Static Threshold Alerts vs RhinoAgents AI Anomaly Detection

Why hardcoded threshold rules cause severe alert fatigue and miss complex outages, and how autonomous ML anomaly agents isolate true root causes.

Capability / Dimension Static Threshold Monitoring RhinoAgents AI Anomaly Agent
Baseline Adaptation Hardcoded static numbers (e.g. CPU > 85%). Quickly becomes noisy or obsolete. Dynamic seasonal ML baselines accounting for diurnal patterns and traffic surges.
Alert Noise & Fatigue Hundreds of false positive pings daily, causing engineers to mute critical channels. 95% reduction in alert noise via multi-node consensus and persistence validation.
Root Cause Analysis Manual triage requiring engineers to grep server logs and query traces across multiple tools. Automated correlation of code commits, database locks, and downstream span failures.
Multivariate Outliers Evaluates metrics in isolation. Completely blind to complex multi-metric systemic failures. Multivariate anomaly models analyzing cross-metric dependencies simultaneously.
Incident Remediation Passive notification requiring manual on-call login, VPN access, and CLI intervention. Automated runbook triggers (pod restarts, traffic reroutes, canary rollbacks) in < 2s.
Agent Library

8 Prebuilt AI Agents for Anomaly Detection

Each agent handles a critical metric, transaction, and infrastructure touchpoint. Connect your Prometheus, Kafka, and cloud feeds — and deploy in minutes.

Time-Series Metric Anomaly Agent
Learns diurnal and seasonal patterns, detecting subtle metric drops and spikes across server infrastructure and APIs.
Seasonal ARIMATime-SeriesNoise Filter
Root Cause Analysis (RCA) Agent
Correlates distributed traces, error logs, and recent code deployments to isolate the exact cause of system failures.
Log CorrelationDeploy DiffsSpan Analysis
Transaction Fraud & Payment Anomaly Agent
Monitors checkout conversion rates, velocity bursts, and chargeback spikes in real time to prevent financial fraud.
Payment VelocityFraud OutliersChargebacks
Database Query & Lock Anomaly Agent
Detects unindexed slow queries, deadlocks, connection pool exhaustion, and replication lag before crashes occur.
Slow QueriesDeadlocksPool Saturation
Cyber Intrusion & Traffic Outlier Agent
Identifies distributed denial-of-service (DDoS) patterns, credential stuffing bursts, and abnormal API scraping behaviors.
DDoS DetectionBot ScrapingWAF Rules
Kubernetes Cluster & Pod Health Agent
Monitors pod OOMKilled events, CrashLoopBackOff states, node disk pressure, and CPU throttling continuously.
K8s HealthOOMKilledAuto-Restart
Microservice Latency & SLO Watchdog Agent
Tracks service-level objectives (SLOs) and error budget burn rates, alerting when P99 latency breaches acceptable thresholds.
SLO TrackingError BudgetsP99 Latency
Self-Healing & Auto-Remediation Agent
Executes pre-approved remediation scripts, scaling cloud resources, restarting frozen services, and rolling back bad deployments.
Auto RollbackSelf HealingRunbook Trigger
Operational Gaps vs AI

Common Bottlenecks.
AI-Powered Execution.

Engineering teams waste hundreds of hours every quarter sifting through alert storms — all preventable with autonomous AI anomaly detection.

Traditional Monitoring Bottlenecks
Alert storms drowning real outages in false positives
Static threshold monitoring generates dozens of non-actionable alerts every night, causing on-call engineers to suffer severe alert fatigue.
Hours spent war-rooming to find the root cause
When a cascading outage occurs, 6 different engineers grep through separate log files and trace graphs to figure out which microservice broke first.
Silent business KPI drops missed by server metrics
Server CPU and RAM show healthy green status while checkout completion drops by 40% due to a subtle third-party payment gateway error.
Delayed manual rollback extending downtime
Bad code deployments take 45+ minutes to diagnose and manually roll back, compounding user impact and SLA breach penalties.
RhinoAgents Autonomous Solution
95% reduction in alert noise via seasonal baselines
Dynamic machine learning models suppress transient spikes and only page on-call engineers when persistent, multi-metric anomalies occur.
Instant root cause isolation in under 2 minutes
The RCA agent correlates trace spans, Git deployments, and database telemetry, delivering a complete natural-language incident brief immediately.
End-to-end business & transaction anomaly tracking
Continuously models checkout rates, payment success percentages, and API request yields to catch revenue-impacting drops instantly.
Autonomous self-healing runbook execution
Automatically triggers canary rollbacks, isolates bad server pods, and applies traffic throttling rules in seconds to protect uptime.
Why RhinoAgents?

Enterprise Anomaly Detection Architecture

Built for mission-critical engineering stacks requiring high-throughput stream processing, OpenTelemetry compliance, and sub-second incident isolation.

Automated Runbook Guardrails

Safe, bounded auto-remediation. Set strict policy limits on automated healing actions—requiring manual confirmation for destructive operations while auto-executing safe pod restarts.

Bounded Actions Policy Guardrails

Historical Incident Memory

The agent remembers past incident post-mortems, recurring infrastructure bottlenecks, and known software bugs, instantly recognizing familiar failure signatures.

Post-Mortem Memory Signature Matching

Modular Telemetry Skills

Equip agents with specific operational Skills from our library. Dynamic skills like "PromQL Metric Query", "Kubernetes Pod Controller", or "GitHub Commit Correlator" execute tasks in sub-seconds.

PromQL Native Zero Prompt Bloat

Model Context Protocol (MCP)

Connect your anomaly detection agent natively to internal ClickHouse clusters, PostgreSQL transactional databases, or Git repositories via secure MCP servers with zero custom glue code.

Native MCP Support Direct Data Warehouse Query

Human-in-the-Loop (HITL)

Retain full control during severe incidents. Configure approval gates so high-impact remediation actions (such as database failover or cluster draining) require 1-click on-call signoff.

1-Click Slack Review SRE Approval Gates

Immutable Audit Logging

Full telemetry audit trails of every metric evaluation, anomaly trigger, RCA correlation, and remediation command executed with 100% SOC 2 and GDPR compliance.

Audit Diffs SOC 2 Certified
Operational Uptime Protection

6 Critical Leaks in Monitoring Operations — Fixed by AI

Every hour spent searching for the root cause of an outage costs thousands in revenue and damages customer trust.

Leak 1
On-Call Alert Fatigue Drowning Real Outages
Engineers receive 200+ false alarms weekly from noisy static thresholds, causing teams to ignore alerts when a real Sev-1 outage strikes.
AI Fixes This
Suppresses 95% of transient metric noise and blips
Dynamically adjusts threshold bands based on seasonal baselines
Only alerts on verified multi-metric systemic deviations
Leak 2
45-Minute MTTR Delays from Manual Log Sifting
When an incident occurs, on-call engineers spend 45+ minutes manually querying logs and trace waterfalls to locate the faulty line of code.
AI Fixes This
Correlates spans, logs, and deployment diffs in 200 milliseconds
Pinpoints the exact microservice and root cause automatically
Cuts incident MTTR by 78% across engineering teams
Leak 3
Unnoticed Database Deadlocks Freezing Checkouts
An unindexed query introduced in a minor release locks database tables, silently dropping checkout completions while server CPU looks normal.
AI Fixes This
Monitors lock graph depth and connection pool saturation
Detects checkout conversion drops in real time
Suggests index additions and kills blocking queries
Leak 4
Delayed Detection of Payment Fraud Bursts
Fraud rings run card testing attacks across your checkout endpoints, generating massive chargeback fines before fraud analysts review logs.
AI Fixes This
Tracks payment authorization velocity and IP clusters live
Identifies automated bot card testing patterns in sub-seconds
Applies dynamic rate limiting and blocks compromised card bins
Leak 5
Slow Canary Rollbacks Extending Production Impact
A buggy canary release increases 500 error rates on mobile users, taking 30 minutes for engineers to notice and execute a manual rollback.
AI Fixes This
Monitors canary vs baseline error ratios in real time
Triggers automated instant rollback upon statistical deviation
Protects production users with zero human intervention delay
Leak 6
Incomplete Incident Post-Mortem Documentation
Engineers skip writing detailed post-mortems due to time constraints, leading to identical outages recurring months later.
AI Fixes This
Auto-generates complete post-mortem markdown documents
Includes timeline of events, root cause evidence, and remediation
Stores failure signatures in long-term agent memory
ROI Model

Calculate Your Anomaly Detection ROI

Estimate the downtime costs saved and engineering hours recovered by eliminating manual log triage and alert fatigue.

Monthly Production Transactions / Requests 50,000,000 reqs
Average Cost of 1 Hour of Downtime $45,000
SRE & DevOps Engineering Team Size 8 Engineers
$360,000
Estimated Annual Downtime & Engineering Savings
320 hrs
Monthly SRE Triage Hours Saved
78%
Incident MTTR Reduction
Enterprise Standards

Enterprise Architecture, Compliance & Security

RhinoAgents is built for mission-critical enterprise telemetry — delivering full OpenTelemetry compliance, SOC 2 Type II certification, and 99.99% uptime.

OpenTelemetry Native
Ingests OTel metrics, logs, and spans seamlessly. Zero vendor lock-in; export telemetry anywhere.
OTel Standards
SOC 2 & GDPR
Bank-grade AES-256 encryption at rest and TLS 1.3 in transit. Zero model training on your telemetry data.
SOC 2 Type II
Granular RBAC
Role-based access permissions for SRE Leads, DevOps Engineers, and Security Auditors.
Okta SSO
99.99% Uptime SLA
High-availability stream processing cluster designed to ingest millions of metric points per second.
Auto-Scaling
Tool Ecosystem

Integrates With Your Metrics & Alerting Stack

RhinoAgents connects natively with major observability backends, stream queues, incident management hubs, and code repositories.

Prometheus / Grafana
Direct PromQL Telemetry Ingest
AWS CloudWatch & Kafka
High-Throughput Stream Sync
PagerDuty & Slack
Incident Triage & Alert Dispatch
GitHub / GitLab
Deployment & Commit Correlation
Full Infrastructure Suite

Connect Anomaly Detection to the Entire AI Ecosystem

Combine real-time anomaly detection with application performance monitoring, AI observability, SAP process automation, and lead qualification agents.

AI APM Monitoring Agent AI LLM Observability Agent AI SAP Process Agent AI Lead Scoring Agent AI SEO & GEO Agent 55+ Website AI Chatbots 102+ Voice AI Call Agents All 81 AI Agent Pages
FAQ

Frequently Asked Questions About AI Anomaly Detection

Everything you need to know about implementing autonomous metric baseline modeling and root cause isolation.

An AI Anomaly Detection Agent is an autonomous machine learning system that continuously monitors high-velocity time-series metrics, transaction streams, and server telemetry. It dynamically models normal statistical baselines and flags multivariate outliers within milliseconds.

"RhinoAgents cut our alert noise by 95% and isolated an unindexed database query during Black Friday in under 45 seconds, saving us an estimated $350,000 in prevented checkout downtime."

Samantha Reed — VP of Site Reliability Engineering, Global FinTech

Ready to Eliminate Alert Fatigue & Master Root Cause Analysis?

Deploy your custom AI Anomaly Detection Agent in under an hour, connect your Prometheus stream, and automate incident resolution.

Schedule Technical Demo Start 14-Day Free Trial
No credit card required Prometheus & OTel Native SOC 2 Type II Certified