


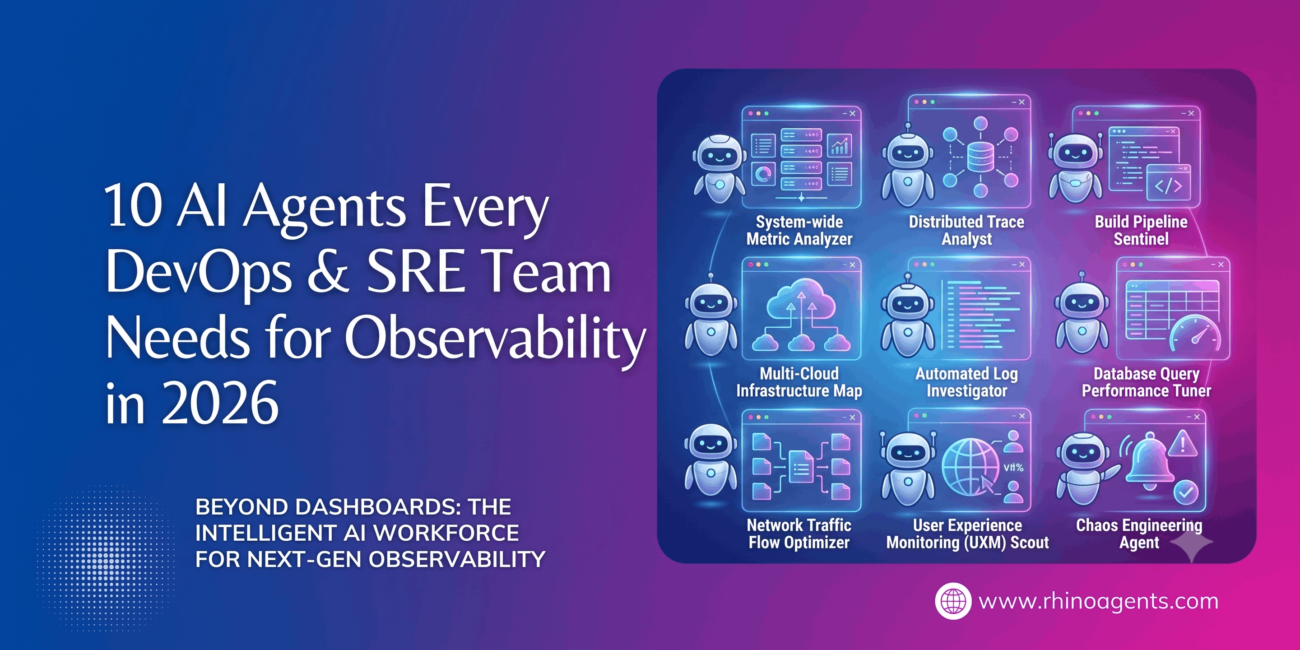
Observability used to mean dashboards. Now it means decisions. As distributed systems have grown from a handful of services to architectures spanning thousands of microservices, containers, and ephemeral cloud functions, the telemetry those systems generate has outpaced any human team’s ability to read it in real time. The result is a familiar story across engineering organizations: more dashboards, more alerts, and somehow less clarity about what’s actually happening in production.
AI agents are changing that equation. Rather than simply visualizing telemetry, AI agents reason over it — correlating logs, metrics, and traces, explaining incidents in plain language, and increasingly, predicting failures before they happen. This shift from passive monitoring to active, AI-driven observability is one of the defining infrastructure trends of 2026, and the numbers back it up.
Why Observability Has Become an AI Problem
The scale of the alert fatigue crisis is staggering. Industry research shows most incident responders receive over 10 alerts per shift, and a typical enterprise can see more than 2,000 alerts per week with only 3% of alerts requiring immediate action. Other studies put the daily number even higher, noting that typical enterprise teams receive 500–1,200 alerts per day, with only a small fraction requiring immediate action.
That noise has a measurable human cost. The Catchpoint SRE Report 2025 found that nearly 70% of SREs say on-call stress has impacted burnout and attrition on their teams, and median time spent on operations rose to 30% in 2025, up from 25% in 2024. Meanwhile, the cost of downtime keeps climbing — unplanned downtime now costs organizations an average of $5,600 per minute.
It’s no surprise, then, that budgets are moving fast toward AI-driven solutions. The AIOps market reached $11.16 billion in 2025, growing at a 25.3% CAGR, with some analysts projecting it will reach $32.56 billion by 2029, and adoption of AI-powered monitoring jumped from 42% to 54% between 2024 and 2025 alone. Yet maturity still has a long way to go: only 4% of organizations have actually operationalized AI across their IT operations, while 49% are still running pilots and 22% haven’t started at all. In other words, the opportunity gap between early adopters and the rest of the market is wide open — and it’s a competitive advantage for whoever closes it first.
This is exactly the gap RhinoAgents’ AI Observability Agent is built to close: a single AI reasoning layer that sits on top of your existing stack and turns raw telemetry into action.
The 10 AI Agents Reshaping Observability
Modern observability isn’t a single AI tool — it’s a coordinated set of specialized agents, each handling a distinct part of the detect-correlate-explain-prevent lifecycle. Here are the ten that matter most in 2026.
1. Log Intelligence Agent
This agent continuously parses structured and unstructured logs across applications, infrastructure, and cloud services, using NLP to extract patterns, flag error signatures, and cluster related events. Instead of engineers grepping through millions of log lines during an incident, the agent surfaces the handful of lines that actually matter — instantly.
2. Dynamic Metrics Monitoring Agent
Static thresholds are one of the biggest sources of alert noise, because they don’t adapt to seasonal traffic, deployment cycles, or business growth. A dynamic metrics agent builds baselines from historical behavior and flags meaningful deviations — even subtle ones — across CPU, memory, latency, and custom business metrics, without the manual tuning legacy monitoring tools require.
3. Distributed Tracing Agent
In a microservices architecture, a single slow API call might pass through a dozen services before failing. A tracing agent maps the full request path, pinpoints the exact span causing latency, and visualizes the dependency chain — cutting investigation time from hours to seconds.
4. Anomaly Detection Agent
Rather than waiting for a hard threshold breach, this agent applies statistical and machine learning models across the full telemetry stack to catch anomalies as they emerge — irregular throughput, unusual error spikes, or abnormal traffic patterns that a static rule would miss entirely.
5. Cross-Signal Correlation Agent
This is the connective tissue of modern observability. A correlation agent links logs, metrics, and traces together, mapping the chain from symptom to contributing factor to root cause. Instead of a flood of disconnected alerts, engineers get one correlated incident with full context attached.
6. AI Root Cause Analysis (RCA) Agent
Using LLM reasoning over correlated signals, an RCA agent explains incidents in plain English — what broke, which services are affected, and what the likely fix is. The results are dramatic: organizations using automated root cause analysis report resolution times up to 70% faster compared to manual log analysis, with some reducing MTTR from 25 hours to under 6 hours — a 78% improvement.
7. Alert Correlation & Noise Suppression Agent
Alert fatigue is solvable. Organizations implementing AIOps-driven correlation routinely see daily alerts drop from over 5,000 to roughly 100 actionable items — and often fewer, with some teams cutting volume from over 800 alerts a day down to 20–50. This agent groups related alerts into a single incident, suppresses flapping noise, and only escalates what genuinely needs human attention.
8. Predictive Outage Prevention Agent
This agent learns from historical telemetry to detect early warning signals — gradual memory growth, rising p99 latency, increasing retry rates — before they cascade into a full outage. As IBM’s 2026 observability outlook puts it, agentic AI is increasingly ingesting observability data not just to detect anomalies, but to work alongside other agents that remediate and prevent disruptions, improving mean time to repair.
9. SLO/SLA Burn Rate Tracking Agent
For teams operating against strict error budgets, this agent monitors burn rate in real time and projects time-to-breach, giving engineers a 30–45 minute warning window to intervene before customers are affected — turning SLO management from a reactive postmortem exercise into a proactive discipline.
10. Post-Incident Retrospective Agent
After every incident, this agent auto-generates a structured post-mortem — timeline, root cause, blast radius, contributing factors, and recommended action items — and exports it directly to your documentation or ITSM platform, eliminating hours of manual write-up.
Together, these ten agents form the backbone of RhinoAgents’ AI Observability Agent, unifying log analysis, metrics monitoring, distributed tracing, root cause analysis, and predictive alerting into a single AI reasoning layer rather than ten separate tools competing for attention.
The Business Case: Why You Need This Now
Alert fatigue is an operational and retention risk
Beyond the engineering cost, alert fatigue is now a talent risk. Teams buried under noisy alerts burn out and leave. Reducing that noise isn’t a nice-to-have — it’s a retention strategy.
MTTR reduction translates directly to revenue protection
Independent analysis shows the financial case is strong on its own. A Forrester-commissioned study found that combining AI observability with automated correlation can cut MTTR by up to 50% and increase revenue-generating app availability by 15%. Other deployments report even steeper gains — cutting MTTR by up to 70% in some configurations. Forrester’s broader ROI research on AI-powered observability platforms found 274% ROI over three years with payback in under six months.
Full-stack visibility is still rare
Despite years of tooling investment, true end-to-end observability remains elusive for most organizations. Only 9% of enterprise software applications achieve full end-to-end observability, leaving teams with blind spots precisely where outages tend to originate — across hybrid and multi-cloud boundaries. AI correlation agents are the most practical way to close that gap without ripping out existing tooling.
Integration gaps are a top blocker
It’s not just about adding AI — it’s about making it talk to the rest of the stack. 39% of organizations report integration gaps that prevent monitoring tools from working seamlessly with ITSM systems and DevOps workflows. This is why observability agents that connect natively into your existing toolchain — rather than requiring a rip-and-replace — see faster time-to-value.
What’s Next: Predictions for AI Observability in 2026 and Beyond
Agentic, autonomous remediation becomes standard. Industry analysts expect the shift to continue moving up the stack — from detection, to explanation, to action. As one 2026 forecast puts it, “by 2026 AI will move from detecting anomalies to being an autonomous agent auto-generating summaries of root cause analysis” — and the next step beyond that is agents that take corrective action with human approval gates.
OpenTelemetry becomes the default instrumentation layer. Vendor-neutral, open-standard telemetry continues to gain share as organizations seek to avoid lock-in, with OpenTelemetry projected to become the dominant standard for instrumentation across the observability market.
Tool consolidation accelerates. Rather than running five to ten disconnected monitoring tools, organizations are converging on fewer, AI-native platforms that unify logs, metrics, and traces into a single reasoning layer — reducing both cost and cognitive overhead for engineering teams.
Business-outcome alignment becomes the new KPI. Observability is shifting from “is the server up” to “is the revenue-critical checkout flow healthy.” Expect more organizations to tie SLOs directly to business metrics, with AI agents tracking burn rate against those outcomes rather than infrastructure metrics alone.
Budgets stay protected even as other IT spend tightens. Because AI observability produces measurable outcomes — lower MTTR, fewer incidents, higher availability — it’s increasingly treated as a protected investment rather than discretionary tooling spend.
How RhinoAgents Helps
RhinoAgents’ AI Observability Agent brings all ten of these capabilities into a single platform that layers on top of your existing stack — no rip-and-replace required. It ingests logs, metrics, and traces from the tools you already use, applies AI reasoning to detect anomalies and correlate signals, and explains incidents in plain English within seconds of detection.
If observability is just one piece of how you’re scaling AI across the business, it’s worth seeing how it fits alongside the rest of RhinoAgents’ agent lineup. Teams running customer-facing operations are pairing observability with AI voice agents for support and scheduling, while go-to-market teams are using the AI BDR Agent to automate prospecting and outreach pipelines. Many of the same engineering principles — reasoning over data instead of just displaying it — apply across every agent in the platform, including the AI chatbots deployed for customer support and the broader AI agents suite built for SMBs and enterprise teams alike.
Why You Need to Act Now, Not Later
The data is consistent across every major research source: alert fatigue is getting worse, not better, as systems grow more distributed. Engineering time is being consumed by manual correlation work that AI agents can do in seconds. And the organizations already deploying AI observability are pulling ahead — fewer incidents reaching production, faster resolution times, and engineers who spend their time building instead of firefighting.
With only a small fraction of organizations having reached full AI maturity in their observability practice, the window to gain a real competitive advantage is still open. The teams that move now — adopting AI agents for log analysis, correlation, root cause analysis, and predictive alerting — will be the ones operating with confidence while their competitors are still digging through dashboards.
Ready to see it in action? Book a demo of the RhinoAgents AI Observability Agent and see how AI-driven correlation, root cause analysis, and predictive alerting can transform your team’s relationship with production incidents.

